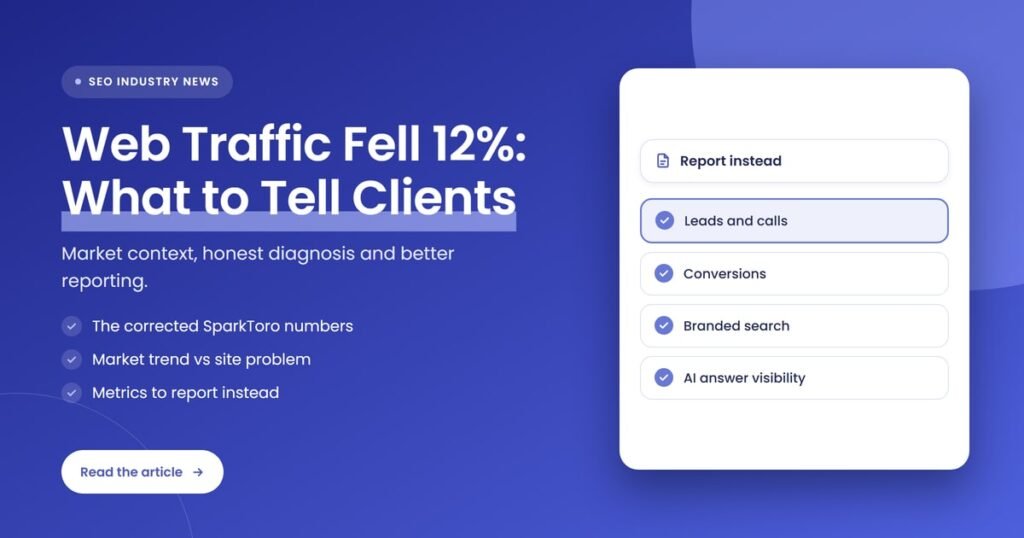
Quick answer: New SparkToro research with Similarweb data shows browser visits to the top million websites fell 12.2% from their early 2022 peak. Agencies should share it as market-wide context, not as an excuse, then check whether the client’s own drop is bigger, and report leads, calls, conversions, branded search and AI visibility alongside traffic.
Key takeaways
- Similarweb data shared by SparkToro puts total visits to the top million websites at 2.243 trillion in Q1 2022 and 1.970 trillion in Q3 2026, a 12.2% decline from the peak.
- The first version of the post said 24%. Rand Fishkin said that version had incorrect data, so use the corrected 12% figure with clients.
- The data counts desktop and mobile browser visits worldwide. It excludes apps and has no regional breakdown, so it is context, not a benchmark for one client.
- A market-wide decline does not explain a client’s drop on its own. Compare the client’s trend, page by page and channel by channel, before you blame the market.
- When visits shrink, reports should lead with outcomes: leads, calls, form fills, sales, branded search demand and visibility in AI answers.
What did the SparkToro and Similarweb data show?
Total browser visits to the world’s top million websites peaked at 2.243 trillion in Q1 2022, fell to 1.914 trillion in Q1 2026 and reached 1.970 trillion in Q3 2026. That latest figure is 12.2% below the peak. The share of visits going to the 100 biggest sites rose only slightly.
Rand Fishkin, SparkToro’s co-founder and CEO, asked Similarweb for total visits to the top million sites from its worldwide desktop and mobile web panel, broken down by site rank. Search Engine Journal covered the findings on November 12, 2026. The headline numbers are below.
| Measure | Figure | What it means for agencies |
|---|---|---|
| Peak visits (Q1 2022) | 2.243 trillion | The starting point for the decline |
| Low point (Q1 2026) | 1.914 trillion, down 14.7% from peak | Many clients saw softer traffic in early 2026 |
| Latest quarter (Q3 2026) | 1.970 trillion, down 12.2% from peak | The corrected headline figure to quote |
| Top 100 sites’ share of visits | About 33% in Q4 2021, about 36% in Q3 2026 | Big sites gained a little share, not a takeover |
| Visits per internet user | Down 29.2% | Relies on revised user estimates, so treat with caution |
Fishkin started with the theory that Big Tech properties were taking a growing share of the web’s traffic. The data only partly supported it. Sites ranked 1 to 100 gained a few points of share, and Fishkin wrote that “stagnation is a more accurate description of the trend.” The bigger story is that the total shrank, so sites outside the top 100 kept a similar share of a smaller pie.
The post did not name a cause. Fishkin listed possible factors, including app-only use, people getting answers on search results pages, AI tools, social media and changes in behavior after the COVID-19 pandemic.
Why did the first headline say 24%?
The original SparkToro post put the five-year decline at 24%. On November 10, 2026, Fishkin said on X that the earlier version had an incorrect graph and data, and the post was updated to the 12.2% figure. The page address still contains the old 24% wording, which is why both numbers are circulating.
This matters for agencies because the 24% figure may already be in client inboxes, newsletters and LinkedIn posts. If a client quotes it back to you, correct it gently and point to the updated numbers. Getting the figure right is part of being the trusted adviser. Quoting a retracted number in a client report does the opposite.
Search Engine Journal also flagged a second caution. The 29.2% drop in visits per internet user divides Similarweb’s visits by DataReportal’s estimates of internet users, and those estimates jumped in Q3 2025 after India and China revised their reported internet use. The 12.2% decline in total visits does not depend on those estimates, so it is the safer number to use.
What is open web traffic, and what is panel data?
Open web traffic means visits to independent websites, as opposed to time spent inside apps, social platforms or a search engine’s own results. Panel data is an estimate built from a sample of users whose browsing is measured, then scaled up. Similarweb’s panel here tracked desktop and mobile browser visits worldwide, not app use.
Two more terms come up when you explain this to clients:
- Top million websites: the million most-visited sites in Similarweb’s data, grouped here into five rank bands, from the top 10 down to sites ranked 100,001 to 1,000,000.
- First-party data: the client’s own numbers from Google Analytics, Search Console, call tracking and their CRM. This is what you report on. Panel data is only background.
The distinction is the core of the client conversation. A panel estimate of the whole web tells you the weather. The client’s own analytics tells you whether their roof is leaking.
What are the limits of this data?
The study measures browser visits only, worldwide, from a panel whose size was not stated. It excludes apps, gives no breakdown by country or industry and does not separate traffic sources. It shows that the open web got smaller overall, but it cannot tell you why a particular client’s traffic fell.
Keep these caveats in mind before you put the numbers in a deck:
- No regional split. Fishkin wrote that it is plausible traffic to US, UK and EU sites declined while regions with growing internet access, such as Asia and Africa, grew. A local business in one city could be in a very different position.
- All sources mixed together. The figure covers every browser visit, from search, social, email, direct and referral. It is not a measure of Google clicks, which earlier zero-click studies looked at.
- Apps excluded. Fishkin noted that consolidation by big platforms is likely much stronger inside apps, which this panel does not see.
- The source sells research tools. SparkToro sells audience research software, and Search Engine Journal noted that Fishkin co-authored a book on zero-click marketing. That does not make the data wrong, but it is worth knowing.
Search Engine Journal’s own advice was that, until a regional breakdown exists, the figures are best treated as global context rather than a benchmark for any single market. That is the right framing for client reports too.
How can you tell a market-wide decline from a problem on the client’s site?
Compare the size, timing and shape of the client’s drop with the wider trend. A gentle decline spread across many pages and channels fits the market. A sudden drop on specific dates, pages or channels points to something site-specific, such as a tracking change, a technical issue, a migration or a Google update.
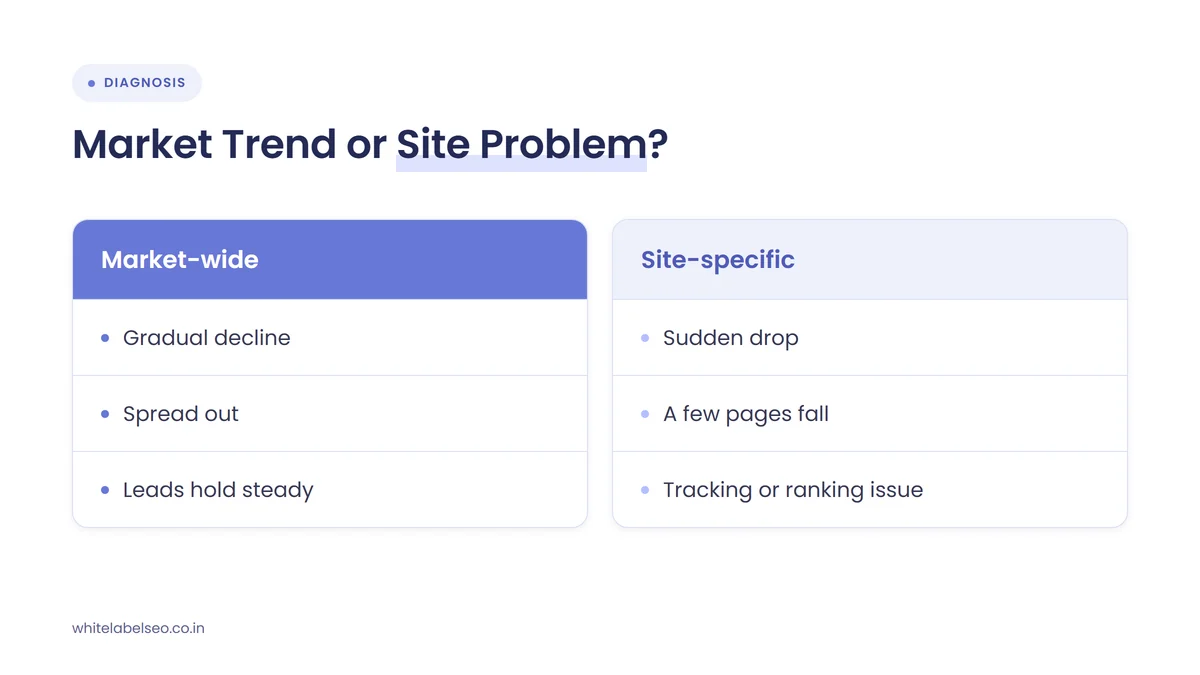
| Signal | Fits a market-wide decline | Points to a site-specific problem |
|---|---|---|
| Timing | Gradual, over quarters | Sharp change on a specific date |
| Spread | Many pages and channels dip a little | A few pages, one section or one channel fall hard |
| Search Console | Impressions hold but clicks soften | Impressions and positions fall, or pages leave the index |
| Analytics vs Search Console | Both move in the same direction | Analytics drops while Search Console clicks are steady |
| Leads and calls | Stable or only slightly lower | Falling in step with traffic |
That analytics row deserves extra care. On November 12, 2026, Google published a help page on identifying Google Search traffic in web analytics and server logs. It explains that Google Search sends a referrer containing only the Google domain, not the search query, and that referrers can be missing because of private browsing, privacy settings and some app-to-browser handoffs.
The same page lists reasons analytics counts can differ from Search Console: consent banners and ad blockers that stop tracking scripts, client-side redirects that replace the referrer, and custom channel rules or referral exclusions that file Google traffic under the wrong channel. So when “organic” traffic drops in analytics but Search Console clicks hold steady, check the tracking setup before you tell anyone the market is shrinking.
If the evidence points to a ranking problem after a Google update rather than a market trend, our guide on handling a client’s ranking drop after a core update covers that conversation step by step.
What should agencies tell clients when traffic dips?
Tell clients the honest version: visits to the web as a whole are lower than in 2022, so some softening is expected, but you have checked their site separately. Then show what you found, what you are doing about it and how leads and revenue are tracking. Context first, diagnosis second, plan third.
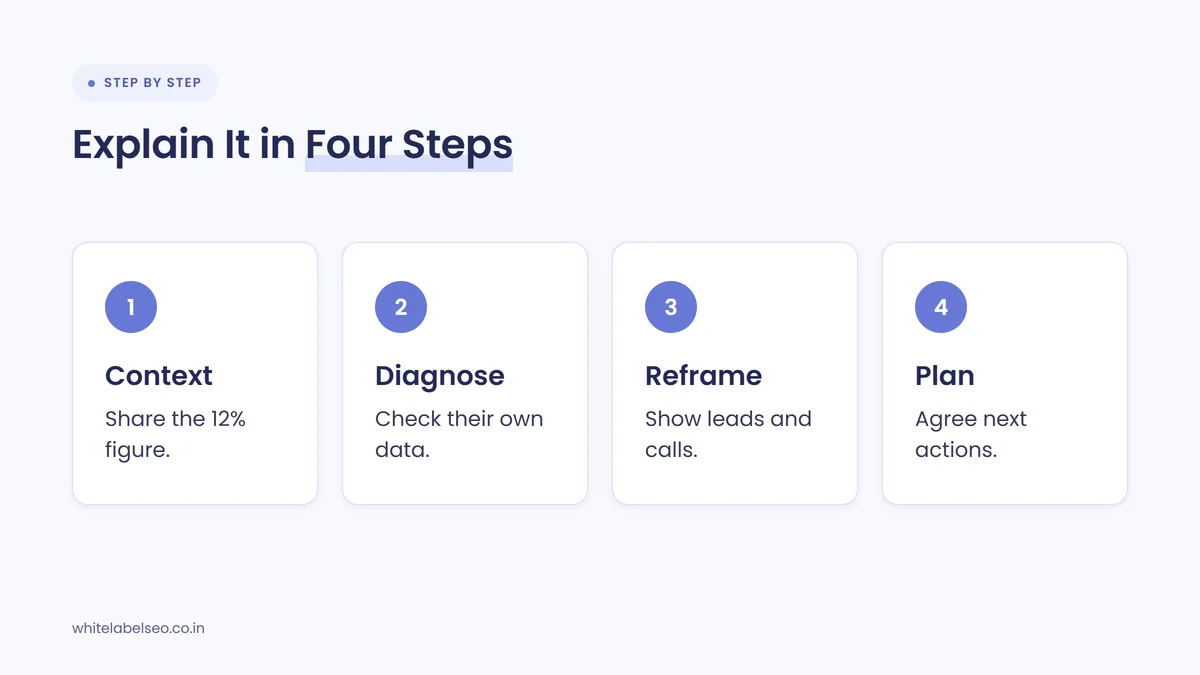
- Give the context once, with the right number. Visits to the top million websites were 12.2% below their 2022 peak in Q3 2026, based on Similarweb’s browser panel. Say it is worldwide, browser-only and an estimate.
- Show the client’s own diagnosis. Compare their trend with the same period last year, split by channel and by page group, and confirm tracking is intact. State plainly whether their drop looks like the market or like something on the site.
- Reframe around outcomes. Put leads, calls, form fills or sales next to the traffic line. If outcomes held while visits dipped, say so. If they fell too, say that as well.
- Agree the plan. List the fixes for anything site-specific, and the work that builds demand and visibility where people now search, including AI answers.
A short message an agency could adapt: “You may have seen reports that web traffic is falling. New Similarweb data shared by SparkToro shows browser visits to the top million websites are about 12% below their 2022 peak, so some softening is happening across the web. We have checked your site separately. Here is how your traffic, enquiries and branded searches compare with last year, what we found, and what we are doing next.”
What not to say matters as much. Don’t use the market trend to cover a drop you haven’t investigated, and don’t promise to bring traffic back to a past peak. Setting this expectation at the start of a relationship is easier than explaining it mid-contract, which is why our guide on setting SEO expectations with new clients covers traffic trends up front.
What should agencies report instead of traffic alone?
Report the outcomes traffic was meant to produce: leads, calls, form fills, bookings or sales, ideally tied to revenue. Add branded search demand, which shows whether more people are looking for the client by name, and visibility in AI answers. Keep traffic in the report, but as one input rather than the headline.
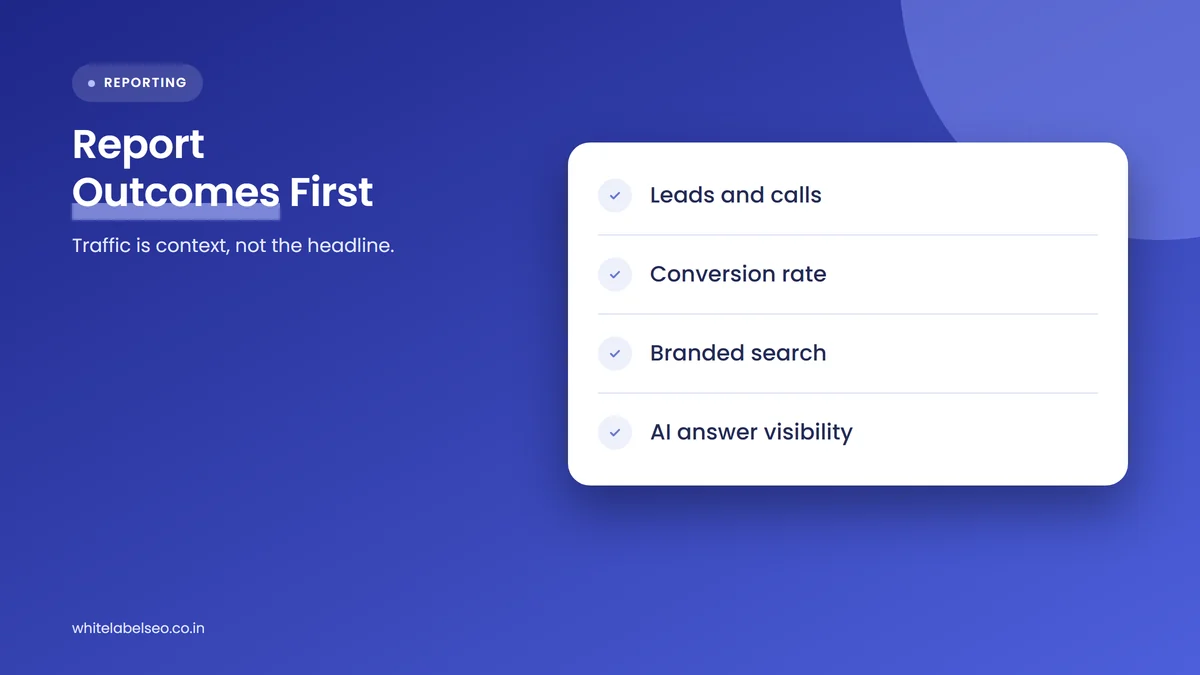
- Leads, calls and conversions. Form submissions, tracked calls, bookings and sales from organic search. These are the numbers owners care about, and they can hold steady even when visits fall.
- Conversion rate from organic visits. If fewer but better-qualified people arrive, this rises and tells a fairer story than raw sessions.
- Branded search demand. Search Console’s branded queries filter, introduced in November 2025 and expanded to all eligible sites in March 2026, splits Performance report data into branded and non-branded queries. Growing branded impressions suggest the client’s reputation is reaching people, even if they find answers elsewhere first.
- Non-branded impressions and positions. These show whether the client is still visible for the topics that matter, separate from whether people click.
- AI answer visibility. Whether the client is mentioned or cited for an agreed set of prompts in Google AI Overviews, AI Mode and ChatGPT, tracked the same way each month.
We cover the full metric set, with definitions and how to present each one, in our post on the metrics agencies should report to SEO clients. For the zero-click side of the same shift, see what to report differently in a zero-click world.
Frequently asked questions
Did traffic to the open web fall 24% or 12%?
About 12%. SparkToro’s first version said 24%, but Rand Fishkin said on November 10, 2026 that it had an incorrect graph and data. The corrected Similarweb figures show visits to the top million websites in Q3 2026 were 12.2% below the Q1 2022 peak.
Does the decline mean SEO is no longer worth paying for?
No. The data shows fewer total browser visits, not that search stopped sending customers. People still search before they buy, but more of their journey happens in apps, search results and AI answers. SEO work now has to be judged on leads, visibility and branded demand, not on visit counts alone.
Can agencies use this data to explain a client’s traffic drop?
Only as background. The figures are worldwide, browser-only panel estimates with no industry or regional breakdown. Use them to explain why some softening is normal, then show the client’s own analysis. If their drop is sharp, recent or limited to certain pages, the cause is probably on or around their site.
Why does Google Analytics show less organic traffic than Search Console?
Google’s help page on identifying Google Search traffic lists several reasons: privacy settings and ad blockers that stop tracking, missing referrers, client-side redirects, custom channel rules, and the difference between a click and a loaded page. Some gap is normal. A sudden new gap usually means a tracking change.
What is the best single metric to show a client when traffic falls?
Qualified leads from organic search, such as calls, form fills or bookings, because they connect SEO to revenue. Show traffic next to it so the client sees both. If leads held while traffic dipped, that is the clearest sign the work is still paying off.
What should you do next?
Update any client report or deck that quotes the old 24% figure, and use the corrected 12.2% number only as worldwide context. Before your next traffic conversation, check each client’s own trend by channel and page group, confirm tracking is intact, and lead the report with leads, branded search and AI visibility. If you want a partner to run these diagnostics and reports under your agency’s brand, see our white-label SEO services at White Label SEO.
Clients asking why their traffic is down?
At White Label SEO, we diagnose traffic drops, separate market trends from site issues and build outcome-focused reports under your agency’s brand. Tell us what your clients are seeing, and we’ll show you how we’d report it.
Sources
- Search Engine Journal (Matt G. Southern), “Visits To The Top Million Websites Fell 12%, Data Shows”, November 12, 2026. https://www.searchenginejournal.com/visits-to-the-top-million-websites-fell-12-data-shows/597085/
- Google Search Central, “Identify Google Search traffic in your web analytics or server logs”, last updated November 12, 2026. https://developers.google.com/search/docs/monitor-debug/identify-google-search-traffic
- Google Search Central Blog, “Introducing the branded queries filter in Search Console”, November 20, 2025, updated March 11, 2026. https://developers.google.com/search/blog/2025/11/search-console-branded-filter